
Drawing the metamorphic gradient consists of (qualitatively) " plotting " the five samples on the PT diagram.
- Sample 1 is at higher temperatures than the reaction that produces biotitee, but at lower temperatures than the reaction that produces garnet, since this mineral does not exist in this rock.
- Sample 2 is at a higher T than the garnet producing reaction.
- Samples 3a
and 3b are within the stability fields of staurolite and kyanite, thus giving a minimum value in pressure.
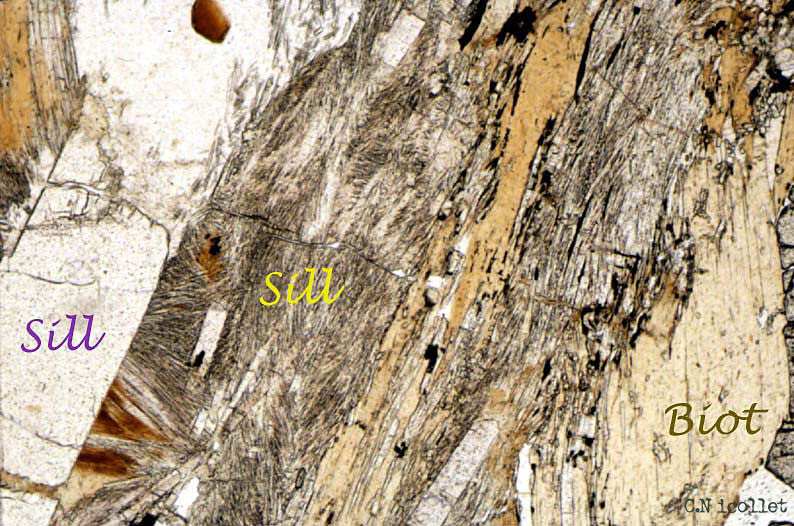
- Sample 4 (with
Sill) is well constrained, since it is in the sillimanite stability field, without crossing the partial melting curve (A); on the other hand, it no longer contains staurotide and no cordierite.
- Sample 5 is beyond the melting curve.
Click on the dots ![]() to see the thin sections.
to see the thin sections.
Géoth. Litosph. stable = steady state geotherm